Instagram analytics for architects: which metrics actually matter
By Vladislav Akhmetov · 8 min read
Open Instagram Insights and you get thirty numbers. Most architecture firms glance at the follower count, maybe the likes, and close it. That is the wrong read, and it is why so many firms cannot tell whether the account is actually working.
Here is the short version: one number tells you whether Instagram is bringing you clients, and it is not followers and definitely not likes. It is the clicks from your profile to your website. Everything else is a step on the way to that click. Below is exactly what we track when we run an architecture account, in the order it matters, and how we read it. It comes from the team that built the #1 architecture account in Germany, roughly 150,000 followers in two years.
What Instagram analytics actually tell an architecture firm
Analytics are not a scoreboard, they are a diagnosis. Every number on the account answers one question: is the work reaching the right people, and is a share of them moving toward becoming a client? Read that way, the metrics stop being vanity and start telling you what to fix. The firms that stall are the ones watching the numbers that feel good instead of the ones that predict revenue.
The funnel we actually report
We report an architecture account as a funnel with four stages, each one narrower than the last:
- Views. How many people the content reached. This is what Instagram now calls views, and it comes almost entirely from reels. It is the top of the funnel and the easiest number to grow, which is also why it is the easiest to over-value.
- Interactions. Saves, shares and comments: the signals that someone did more than scroll past. This is where you see whether the content actually landed, not just how far it travelled.
- Profile visits. The people who saw the work and were curious enough to tap through to the account itself. This is the moment a stranger starts to consider you.
- Potential leads. The clicks from the profile to your website. This is the only number that turns into an inquiry, and it is our north star.
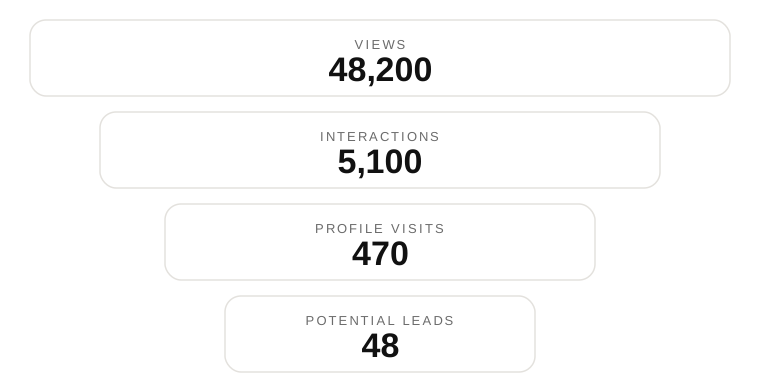
You can have millions of views and almost no leads. If the views come from the wrong audience, they build recognition but little business. Recognition matters, but clients matter first, so we optimise the whole funnel toward that last number. Growing each stage is a content problem, which we cover in our Instagram strategy for architects. This piece is about reading whether it is working.
Why we watch saves, shares and retention, not likes
Likes are the number Instagram shows first and the one that tells you least. Very few people like anything, even content they value. Think about your own behaviour: you scroll past a lot, and you rarely tap the heart. When something genuinely lands, people do one of two other things instead. They save it, or they send it to someone. So those are the signals we read:
- Saves tell us the content was worth keeping. A high save rate on a topic is a clear instruction about what this audience wants more of.
- Shares tell us the content was worth passing on, and shares are what accelerate reach. A reel that gets sent from person to person travels far faster than one that only gets liked.
- Retention on reels, how long people keep watching before they drop off, tells us whether the video holds attention. It matters far more than the like count, because the platform pushes content people finish.
None of these predict in advance whether a given reel will take off. We do not try to forecast that. We publish a range of content, read what the audience rewards, and make more of it.
Reading the numbers: what each pattern tells us
The single metrics matter less than the pattern between them. A few of the reads we make every month:
- Views climb but profile visits stay flat. The content travels but gives no reason to look closer. Usually a weak or missing call to action: the post entertains and ends, instead of pointing somewhere.
- Views and profile visits are up, but link clicks are not. People reach the profile and stop. That points at the bio and the link, so we rework the profile until it makes the case to click through.
- Views are not growing at all. The content is not catching the algorithm. We adapt current trends to the niche, so the account rides formats that are already moving instead of posting into silence.
- One topic gets an unusually high save rate. That is the audience telling you what it values. One engineering firm we work with posts explainers of complex bridge structures, and those posts were saved far more than anything else on the account, roughly one viewer in five keeping them. The read was obvious: this audience wants the teaching content, so we made more of it. Most of that raw material is already sitting in a firm's project files.
How we connect a click to a lead
A view is anonymous. A lead is not, and the bridge between them is a single link. We treat a lead as a click on the link in the profile header, and we make that click traceable with a UTM tag.
A UTM tag is a short piece of text added to the end of the link, something like ?utm_source=instagram. It is invisible to the visitor and changes nothing about the page, but it tells your website analytics where the person came from. So when someone taps the link in your bio and later fills in your contact form, that inquiry can be traced back to Instagram specifically, instead of getting lost in a pile of anonymous traffic. Without it, you are guessing which channel brought the client. With it, the funnel closes: view, interaction, profile visit, click, and a lead you can actually attribute.
What is in the monthly report
Once a month we turn all of this into a single report, not a raw export. We use Instagram's native Insights plus our own reporting tool, and the output is a clean PDF a client can read in ten minutes. It contains:
- every metric with a plain explanation of what it means,
- the comparison against the previous period, so growth is visible at a glance,
- where the bottleneck is this month, the one stage of the funnel holding the rest back,
- the top content that performed, and why we think it did,
- the audience: geography and who is actually watching,
- and concrete recommendations for the next month.
Then Maria walks through it with the client on a one-hour call. The report is not there to look impressive. It is there to make the next month's decisions obvious.
How long before the numbers move
The honest timeline: the first month often shows little growth, and this is where most firms give up. That flat month is not failure, it is the algorithm learning that the account is starting to gain traction. Real growth tends to arrive in the second or third month, and when it does, the change is usually a multiple, not a few percent.
What counts as good growth depends on the goal. If the aim is pure reach and recognition, views are the headline. If the aim is the right audience and qualified leads, raw views matter less and the lower funnel matters more. We set the target with the client at the start and report against it, rather than celebrating whichever number happens to look best that month.
Common questions
Which Instagram metric matters most for an architecture firm? The clicks from your profile to your website. Views, saves and profile visits all matter as stages that lead to it, but the click is the only one that becomes an inquiry.
Are likes worth tracking at all? Barely. Very few people like even content they value, so the number is a weak signal. Saves, shares and reel retention tell you far more about whether the content is working.
How do you know a lead came from Instagram? A UTM tag on the bio link marks the visit as coming from Instagram, so an inquiry that starts with that click can be attributed to the channel instead of guessed at.
Why is there no growth in the first month? The algorithm needs time to register that the account is gaining traction. A flat first month is normal. The firms that push through usually see the real growth start in month two or three.
The number that matters
Numbers are not the point of an architecture account. Clients are. Analytics just make sure you are building toward clients, instead of collecting likes that feel like progress and lead nowhere.
This is one part of a bigger system, which we lay out in full in Instagram marketing for architects. If you would rather see this funnel in a report you can actually read, every month, tell us about your firm. We run Instagram and LinkedIn for architecture and engineering firms end to end, measured by people from your own field.
About the author
Vladislav Akhmetov
Vladislav Akhmetov is the co-founder and CTO of Skala Social. An engineer by training, he built the analytics and reporting the agency runs on, turning Instagram data into the monthly funnel that tells architecture and engineering firms where their leads actually come from.
Read next